Ad by early code
From beginner to Expert!
Early Code Institute provide hands-on data analytics course that teaches you how to work with professionals to solve real problems, and build job ready portfolio.
Learn Data Analytics Beyond Theory- Build Real Data Skills
Anna Edeghoghene Enerieta - Published January 6, 2026
Learning data analytics is a game changer for anyone looking to stay relevant in the job market. Early Code Institute is one of the leading tech training centers in Abuja. Data Analytics program at Early Code is beginner friendly, practical and focuses on real world tools.
To work with data, you need the right tools that make analysis easier and faster. Tools like Excel, Power BI, Tableau, SQL, and Python help you clean, analyse, and visualise data.
They turn confusing numbers into clear insights you can use to make smart decisions. Some tools are beginner-friendly, while others offer more advanced features.
Data Analytics
Companies rely on data to understand customer behaviour, improve service structure, stay updated, keep stocks, monitor market demand, stay ahead of the competition and make profit.
With tools like Power BI, SQL, and Tableau, data analysts construct, organize and visualize data to discover patterns and trends.
Data analytics is not just about numbers but it's about solving problems in today's world, making better choices that bring growth with relevant facts.
Learn Data Analytics in Early Code Institute practical classes
Nyanya Learning Center
Services: Trainings, Mentorship, SIWES Placement, and Internship
Benefits: Why Data Analytics Matter
The world is becoming data driven. Each and every decision making is now based on the data available. Every business generates data from customer interactions to backend processes.
Without analytics data is just noise. Data analytics transforms this noise into actionable insights that drive growth, resource and innovation.
Here are the benefits
- Higher Career Demand: The demand for data analysts in Nigeria today is rapidly growing, as businesses increase, so is the need for data analysts.
- Competitive Advantage: With tools like SQL, Power BI and Tableau, organizations can go beyond guess work and basic decisions into creating reliable facts(real evidence).
- Diverse Industry Applications: Data Analytics is not limited to only tech companies. Organizations like Healthcare centers, Retail and E-commerce, Finance, Schools, etc, use data analytics to make better decisions, solve problems, and improve performance across the globe.
- Decision Making: Data driving decision making involves collecting relevant data, analyzing it, and using the insights to choose the best course of action.
IDC predicts that the Global Datasphere will grow from 33 Zettabytes (ZB) in 2018 to 175 ZB by 2025.- International Data Corporation(IDC)
Classroom Projects by Students and Instructor
Early Code Institute is known for its principles of project-based learning, robust professional portfolio building. Making sure you complete several major projects using real datasets, giving you tangible proof of your skills and experience to show potential employers.
Below are some projects done in the classroom:
- Mercedes-Benz Analysis
- Product and Market Performance Analytics
- Loan Analysis
Mercedes-Benz Analysis
This analysis was conducted with a Business Intelligence application called Tableau Public, which enables users to convert data relating to Mercedes cars sold in certain countries into meaningful insight that guides us in making quality decisions.
Developed on 19th September, 2025.
This analysis answers the following Questions.
- What is the average Age of customers who purchase a car?
- What is the Total Quantity?
- What is the Total Sales?
- What is the Sales performance over a period of months?
- What is the Sales performance over the years?
- Which Country Purchased the most Cars?
- Which Car was the Most sold?
- Which Payment Mode was most reliable to Customers?
- Which Sales Representative made the Most Sales?
Purpose of this Project
- To enable students to understand how to analyze and navigate real-world datasets with Tableau.
- To know which of the following countries patronizes Mercedes products the most.
Product and Market Performance Analytics
This Product and Market Analysis report provides a comprehensive examination of sales performance, profitability drivers, and regional market dynamics.
The analysis is anchored by a detailed assessment of temporal performance, evaluating the month-to-month and year-to-year growth/decline in both Total Revenue and Quantity Sold to understand underlying market velocity and seasonality.
A core component is the Revenue Driver Analysis, which calculates the Average Unit Price and isolates whether changes in Total Revenue are primarily driven by Price increases or Volume increases (Quantity Sold).
Created on the 25th October, 2025.
Purpose of this Project
- Assessing Business Health and Momentum
- Identifying Core Revenue Drivers
- Targeting Market Effort
- Optimizing Product Portfolio
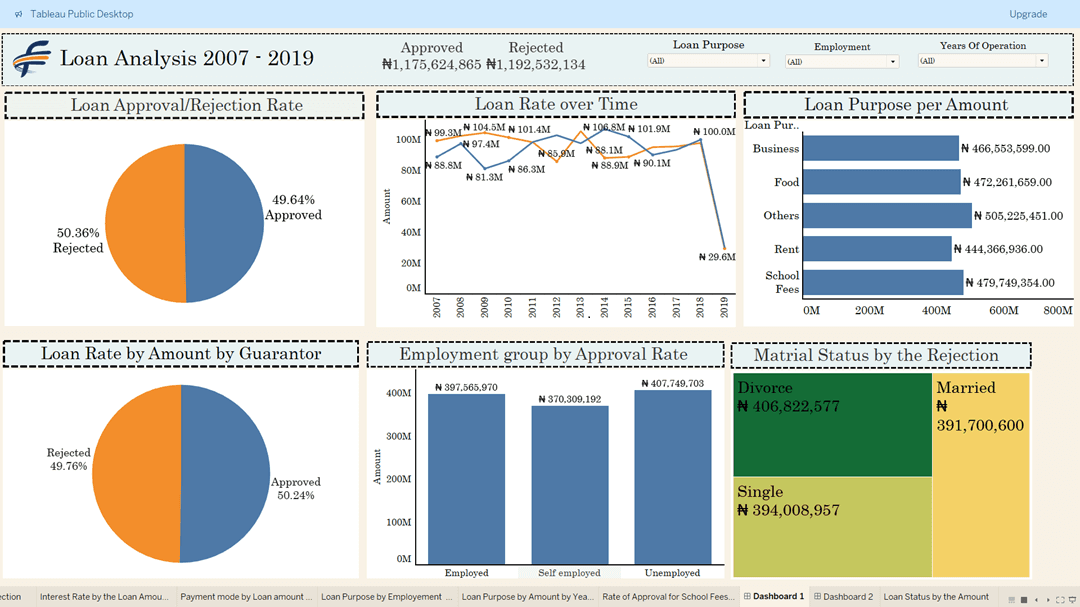
Loan Analysis
This Tableau-driven Loan Portfolio and Risk Analysis project is specifically designed to measure the success of the company's lending activities against the core business objective of Profit Maximization.
This Loan Portfolio and Risk Analysis report provides a comprehensive, visual assessment of the company's lending performance, borrower segmentation, and underwriting efficiency, utilizing key data points like Loan Purpose, Loan Type, Amount, and Employment Status. Created on the 8th of November 2025.
The analysis focuses on critical metrics essential for future strategic decision-making:
- Performance and Trend Analysis: We evaluate the overall Loan Approval Rate (%) and its trend over time to benchmark lending efficiency and track market responsiveness.
- Risk Exposure and Volume: A comparative analysis is provided on the Total Amount requested between approved and rejected applications to quantify potential opportunity cost and risk acceptance.
- Borrower Profiling: Insights are generated by identifying the top 5 most frequent Loan Purpose Categories and pinpointing the Employment Status groups with the highest approval rates.
- Policy Optimization: The analysis quantifies the impact of key variables, such as the presence of a Guarantor, on the approval rate to validate and optimize current lending policies.
Purpose of this Project
We designed this project to give us a clear, data-based roadmap. It helps us figure out the very best way to approve loans, so we can stop taking unnecessary risks down the line. Think of it as a strategic guide for our entire lending business.
Our goal is simply to make sure our loan portfolio is managed smartly, always pushing for long-term profit. Essentially, we use the numbers to make better decisions that keep our business healthy and growing.
Tools used in Developing These Projects
To work with data, there are tools that make analysis easier and faster. They turn confusing numbers into clear insight
Tools:
- Microsoft Excel:Excel is the first tool used in data analytics. It is widely used for basic data entry, cleaning, and calculations. With functions like VLOOKUP, PivotTables, and charts, Excel helps you manage small to medium sized datasets and perform quick analyses
- Power BI: Power BI is a powerful business intelligence tool from Microsoft. It allows users to connect data from multiple sources and create interactive dashboards and reports. It is used for business settings for tracking KPIs, sales performance and customer insight in real time.
- Tableau: This tool is used to create interactive data visualisations. It helps analysts dig deep into data trends and patterns. With its drag and drop interface, it's easy to use even for beginners, yet powerful enough for advanced analysis.
- SQL(Structured Query Language): SQL is a language of databases. It allows analysts to extract and manipulate data stored in large systems like MySQL, PostgreSQL, and Microsoft SQL server. It's a must have skill for working with structured data.
- Python: Python is a flexible and powerful language used for advanced analytics, automation, and machine learning. With libraries like Pandas, NumPy, and Matplotlib, Python allows for deep data analysis and custom solutions. It's widely used in tech, finance, healthcare, and research for solving complex data problems.
Why Choose Early Code Institute
- Practical Curriculum: Early Code focuses on practical function, not just watching slides or memorizing theory. The training is hands-on, from day1, you will be working with real datasets, analysing and presenting insights using industry tools.
- Expert Instructors: You will learn from instructors that work in the field of tech, have real world experience, and know what companies are looking for.
- Affordable and Flexible:Early Code solves the problem of high cost of tech programs and training.
- Smart Decision: Clear insight from data lead to better business and career decisions.Support After Training: Early Code offers internship and mentorship program after training.
How to get stated
Contact the campus representatives to start your classes, which are held physically at specific schedules and are instructor-led. Early Code Institute operates two state-of-the-art physical training centers in Abuja:
Author's Bio

Anna Edeghoghene Enerieta
A Technical Writer and PublisherA creative storyteller who brings words and visuals to life, a technical writer who simplifies tech concept through clear, engaging content. With a background in English Education, writes practical guides and articles to help beginners navigate the digital world with confidence.